The Secret Of Heatmaps: Short Guide
Website heatmaps are an important part of a full-suite online analytics solution.
Quick Links
They combine hundreds of data points into a single visual representation of on-page user activity. These data-rich heatmaps show you where visitors click, what attracts them, why they become annoyed, and more, all in the hopes of improving your user experience.
What are heatmaps?
A heatmap is a graphic depiction of aggregate data points on a website.
Color coding is used in website heatmap applications to signify increasing and reduced levels of activity. Website heatmaps have become more popular over the last decade.
Analysts, UX analysts, product managers, digital marketers, and a range of other professions utilize website heatmaps on a regular basis.
Heatmaps, unlike other raw analytics platforms (for example Google Analytics), present aggregate data graphically.
The majority of analytics programs give basic information on what people do on your website, which is beneficial.
However, it does not explain why people behave as they do on your site. Heatmaps can help with this. It’s also marketing analytics’ missing connection.
These provide you with a visual representation of user behavior and make it simple to act on.

Source: https://freepik.com/
Types of heatmaps
There are six different forms of heatmaps available now. The following are some of them:
- Segment
- Movement
- Scroll
- Click
- Geo
- Attention
On your website, each heatmap records and shows several forms of user behavior.
Each one may be interpreted and used to take action. We’ll go through each of the five categories and the advantages of each.
Segment heatmaps
You can find out where the majority of your traffic originates from using segment heatmaps.
With this in mind, if you’re having problems keeping track of your purchases, the following information can assist you.
You can get a lot of helpful data with these data visualization tools. But what about movement tools?
Movement heatmaps
Tools that show where visitors move their mouse on a website are known as movement heatmaps. This heatmap is useful since it shows which portions of your website receive the most interest from the mouse.
It is also known as session replay.
The best page layout depends on your visitors, the sort of website, and how they engage with it in actuality.
I often advise my customers that each page of their site should have one conversion objective. Make sure that material that supports that aim is in the “hot” portions of each session replay.
This will increase conversions and enhance usability.
When looking at a session replay, you have to ask yourself two questions:
· Do the hottest spots help me achieve my overall page goal?
· Are there any burning topics in the content that aren’t clearly explained?
If this is the case, visitors may be interested in knowing more, and you should consider making some changes.
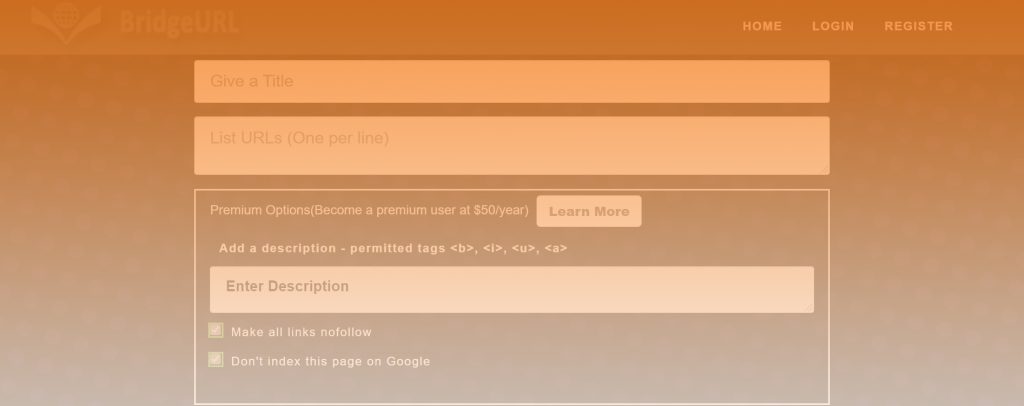
Scroll heatmaps
Scroll heatmaps show how much of the page your visitors can see.
A scroll heatmap’s folds reflect the average visibility and time spent on each section of the page.
Let’s face it, you have no idea how your website visitors will navigate. A scroll heatmaps, on the other hand, shows you if visitors can see or interact with material as you expect.
A call to action button, for example, is nearly always best placed at the top fold of your page.
However, this is not always the case with websites.
When examining a scroll heatmap, we want to pose three questions:
· Is vital material visible above the fold line
· It supports the aim of each page?
· Is there enough time spent seeing or engaging with the most crucial portions of each page?
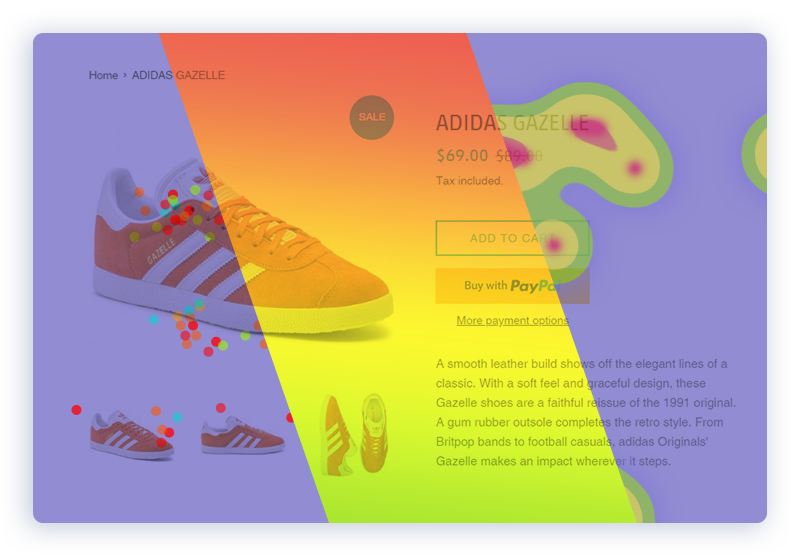
Click heatmaps
A click heatmap is self-explanatory.
It shows where visitors to your website click. It’s really useful for determining the efficiency of links on your site. A click heatmap can show you precisely where users are clicking on your website, whether it’s a navigation bar or a call to action element.
Because the majority of visitors will likely view your home page, you should expect a high volume of clicks.
However, there are some sites and places where having clicks is unnecessary.
This occurs when visitors are perplexed or mistakenly believe that something is clickable when it isn’t.
Geographical
A geo heatmap shows a visitor to your website’s general location.
These heatmaps may help you improve your marketing efforts by showing you which regions, cities, and places have the most potential.
Geographical heatmaps are a favorite of global analysts because they can be used to visualize all kinds of data, even outside of the web.
The geo heatmaps may then be filtered to provide further information about your clients, allowing you to run targeted ads to specific individuals.
Consider the following scenario: you run an eCommerce site.
The heatmap may be filtered to show just people that left your page. This filter displays the broad locations of all visitors who were interested in your product but left before completing the checkout process.
You might then run targeted Facebook and Instagram advertising in those prospects’ locations to revive product interest.
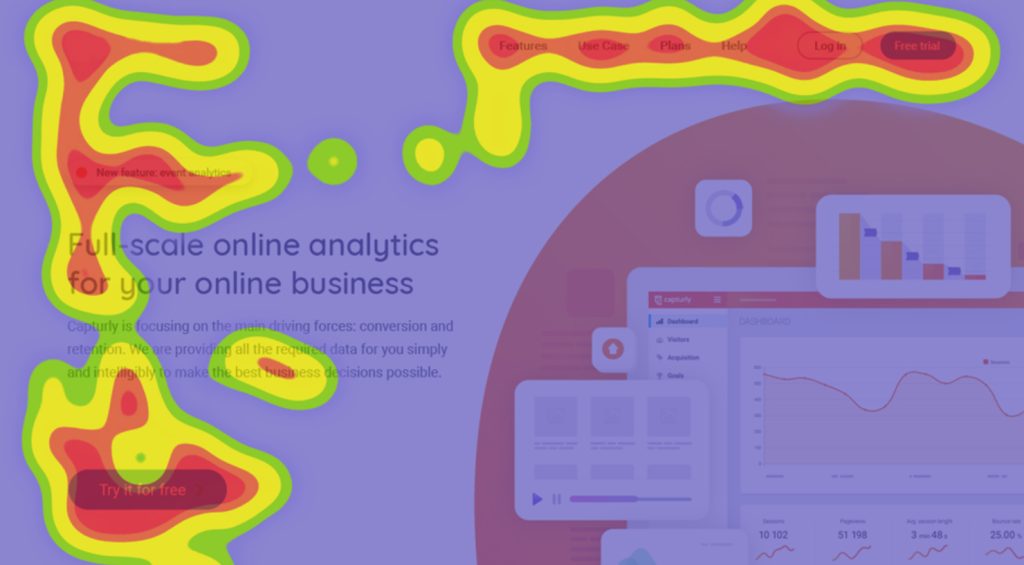
Attention heatmaps
You’ll get various different data when you hover over a portion of the attention heatmap.
On that portion of the page, you’ll notice a view percentage, average time spent on this specific part of the page, and average engagement.
This is highly useful since it allows you to determine which areas of your page are the most appealing to your visitors. When you examine your website, look for crucial parts that are in colder places, suggesting that they aren’t getting as much attention.
In summary
Heatmaps are a useful tool for assessing user behavior on various pages of your website in aggregate.
They can tell you where your visitors are clicking, which portions of the page are the most intriguing and engaging, whether users are confused or struggling if visitors are missing the most important elements of your website, and much more.
These are an essential tool for understanding visitor behavior on your website, whether you’re doing a website redesign, aiming to increase conversions, or making modest modifications to items throughout your site.
We hope we can help.
What Is WooCommerce Product Slider and Why Your Store Needs It
Why Do Product Images Matter So Much in Online Stores? When someone visits an online store the…
0 Comments9 Minutes

How to Streamline Your Customers’ Shopping Experience?
The goal for any online store is to make shopping as smooth as possible. When visitors move…
0 Comments8 Minutes

Strengthening Brand-Customer Relationships Through Gamified Loyalty Programs
Creating lasting connections with customers has become increasingly vital as the marketplace grows…
0 Comments6 Minutes

How to Use SEO and SEA Together in Search Engine Marketing
In digital marketing, search engine marketing (SEM) plays a critical role in improving online…
0 Comments10 Minutes
Content Marketing Growth Hacks: Real Shortcuts to Drive Traffic
Are you still lagging in content marketing? Sticking to these old strategies seems…
0 Comments10 Minutes

How to Build a Strong Local Following Using Social Media Marketing
In the days of likes, shares, and stories, local businesses have a golden opportunity to create…
0 Comments9 Minutes

Why WooCommerce is the Best Choice for Your Online Store?
WooCommerce stands out as a top option for anyone looking to build an online store. This platform…
0 Comments8 Minutes

How to Use AI-Powered SEO Tools for WordPress eCommerce
SEO is a critical factor in the success of any e-commerce WordPress store. As competition…
0 Comments11 Minutes