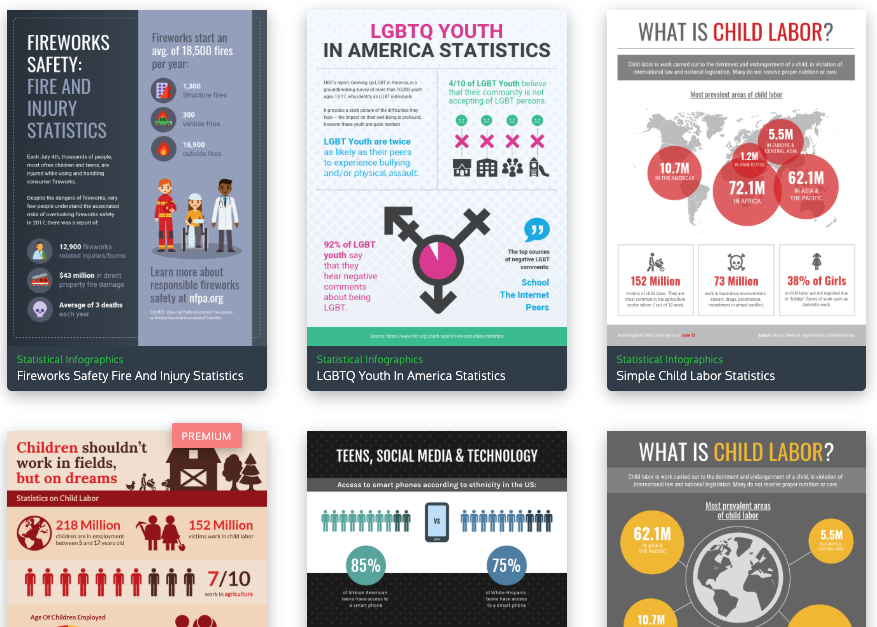
Why You Should Be Using Statistical Infographics
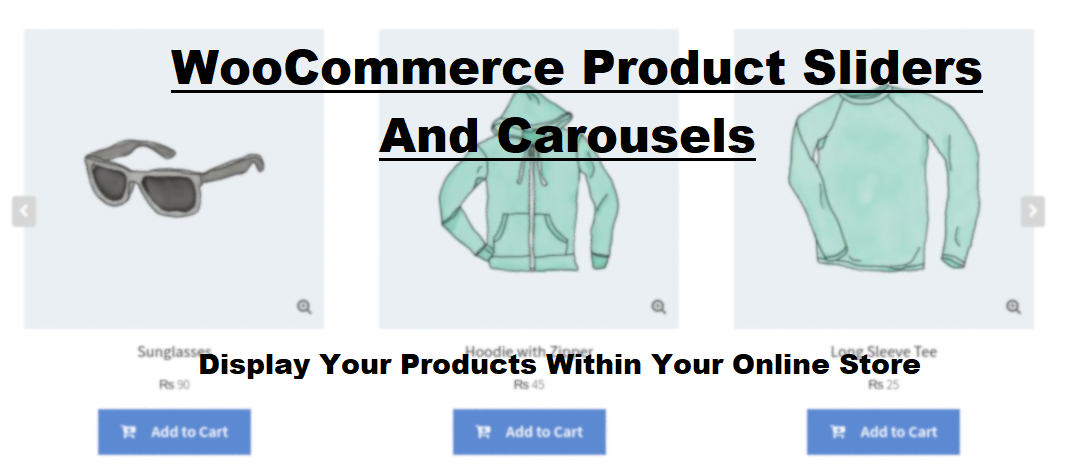
What Is WooCommerce Product Slider and Why Your Store Needs It
Why Do Product Images Matter So Much in Online Stores? When someone visits an online store the…
0 Comments9 Minutes

How to Streamline Your Customers’ Shopping Experience?
The goal for any online store is to make shopping as smooth as possible. When visitors move…
0 Comments8 Minutes

Strengthening Brand-Customer Relationships Through Gamified Loyalty Programs
Creating lasting connections with customers has become increasingly vital as the marketplace grows…
0 Comments6 Minutes

How to Use SEO and SEA Together in Search Engine Marketing
In digital marketing, search engine marketing (SEM) plays a critical role in improving online…
0 Comments10 Minutes
Content Marketing Growth Hacks: Real Shortcuts to Drive Traffic
Are you still lagging in content marketing? Sticking to these old strategies seems…
0 Comments10 Minutes

How to Build a Strong Local Following Using Social Media Marketing
In the days of likes, shares, and stories, local businesses have a golden opportunity to create…
0 Comments9 Minutes

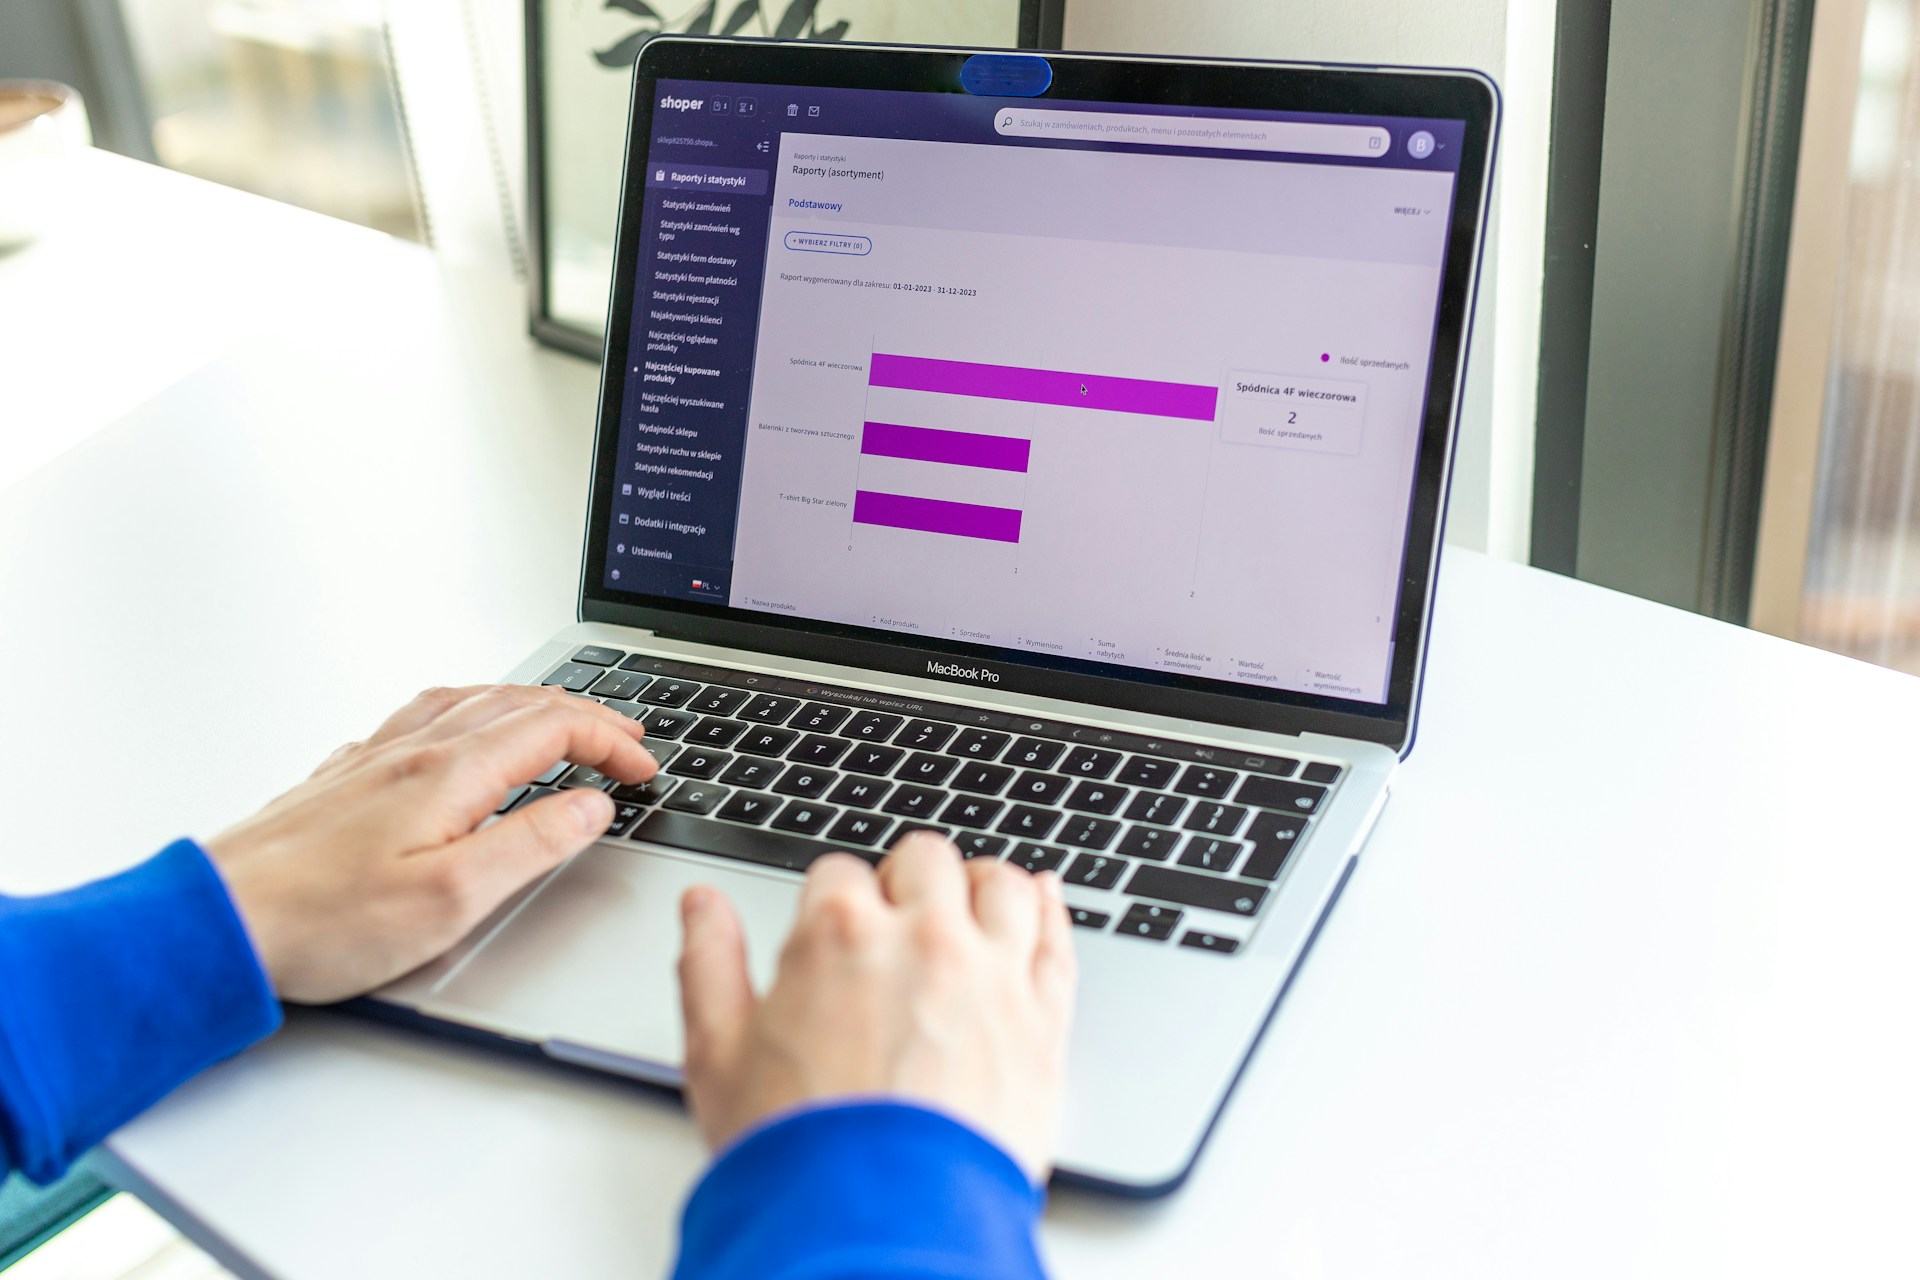
Why WooCommerce is the Best Choice for Your Online Store?
WooCommerce stands out as a top option for anyone looking to build an online store. This platform…
0 Comments8 Minutes
How to Use AI-Powered SEO Tools for WordPress eCommerce
SEO is a critical factor in the success of any e-commerce WordPress store. As competition…
0 Comments11 Minutes