
TikTok vs. Instagram Reels Creatopy Case Study
Engaged in a fierce competition for users’ attention, social media platforms keep releasing new features in order to stay relevant. This was the case when Instagram released Reels in order to keep up with the newest kid on the block, TikTok.
As a result, more and more opportunities arise for marketers and merchants in terms of advertising and selling their products on social media. Brands have the chance to build a presence on popular platforms and reach millions of users, or even more.
But it’s not exactly easy, as there are many options out there to choose from.
However, by checking people’s preferences, one thing is clear: the video format is the way to go. With video’s huge success over the past years, it’s no wonder Instagram Reels vs. TikTok became a rivalry much discussed in the marketing world.
To make life a bit easier for marketers, Creatopy ran an experiment to find out which format performs better in terms of paid advertising, a key factor in brand awareness, which is the first step into a customer’s journey.
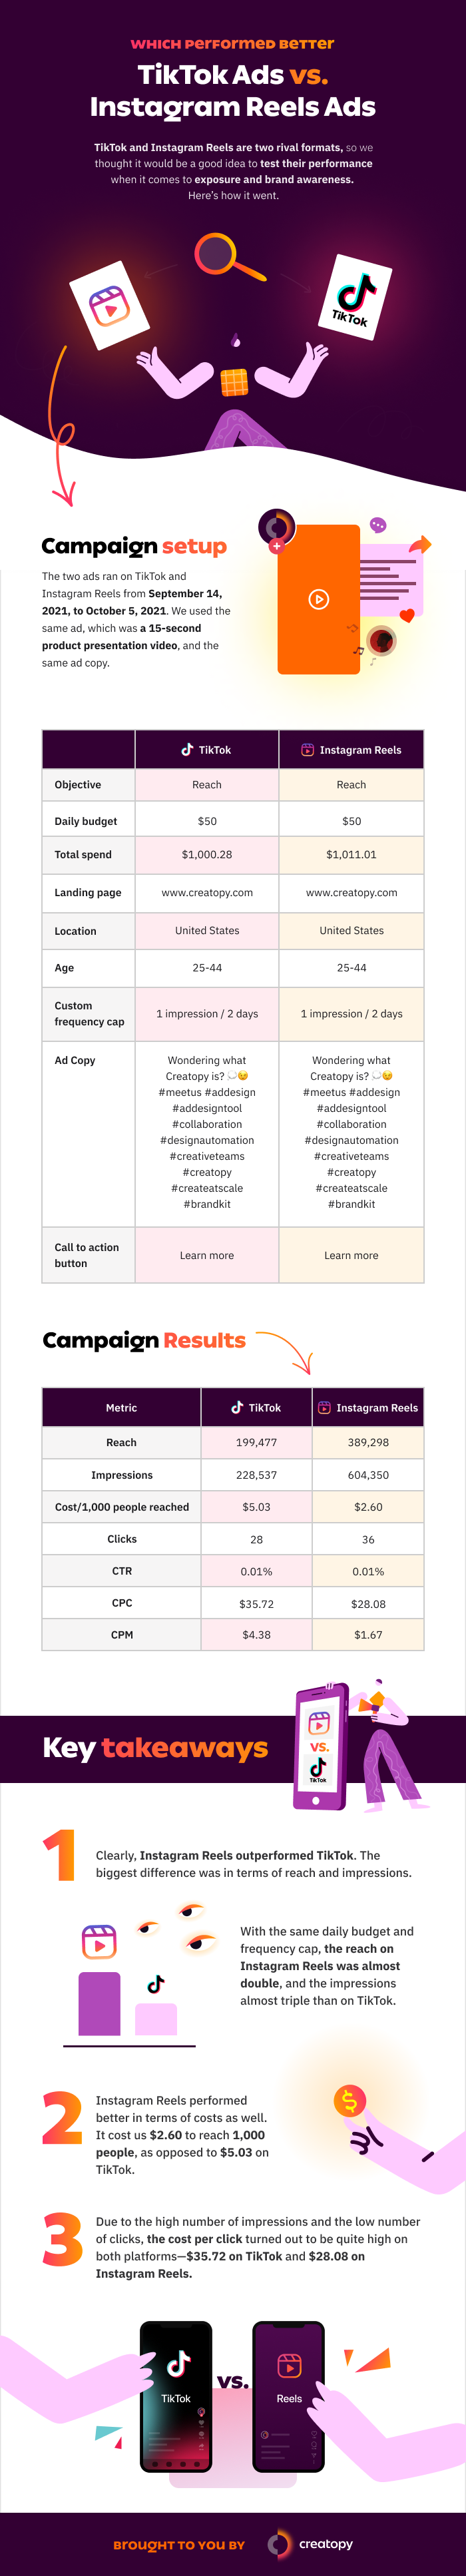
They ran two video ad campaigns on the platforms between September 14 and October 5, with the same objective (Reach), the same daily budget ($50), the same video, ad copy, and landing page. The targeted audiences were in the same age group, with similar locations and interests.
The result was unexpected for both their PPC team and Social Media Manager, with Instagram Reels outperforming TikTok:
- The Instagram Reels ad performed better than the TikTok Ad in terms of reach and impressions.
- The Instagram Reel ad had almost double the reach and nearly three times the number of impressions compared to the TikTok Ad.
- The TikTok Ad cost us more in terms of CPC, CPM, and cost per 1,000 people reached.
These were just a few highlights, but you can read the entire case study for more details about the campaigns and other things the Creatopy team noticed during this experiment.
You can also go over a breakdown of the experiment in the infographic below.
What Is WooCommerce Product Slider and Why Your Store Needs It
Why Do Product Images Matter So Much in Online Stores? When someone visits an online store the…
0 Comments9 Minutes

How to Streamline Your Customers’ Shopping Experience?
The goal for any online store is to make shopping as smooth as possible. When visitors move…
0 Comments8 Minutes

Strengthening Brand-Customer Relationships Through Gamified Loyalty Programs
Creating lasting connections with customers has become increasingly vital as the marketplace grows…
0 Comments6 Minutes

How to Use SEO and SEA Together in Search Engine Marketing
In digital marketing, search engine marketing (SEM) plays a critical role in improving online…
0 Comments10 Minutes

Content Marketing Growth Hacks: Real Shortcuts to Drive Traffic
Are you still lagging in content marketing? Sticking to these old strategies seems…
0 Comments10 Minutes

How to Build a Strong Local Following Using Social Media Marketing
In the days of likes, shares, and stories, local businesses have a golden opportunity to create…
0 Comments9 Minutes

Why WooCommerce is the Best Choice for Your Online Store?
WooCommerce stands out as a top option for anyone looking to build an online store. This platform…
0 Comments8 Minutes

How to Use AI-Powered SEO Tools for WordPress eCommerce
SEO is a critical factor in the success of any e-commerce WordPress store. As competition…
0 Comments11 Minutes