
The definitive guide on how to make an Infographic
Learning how to make an infographic can boost your content marketing.
We all know that people tend to retain visual information for much longer than text-based information. This is exactly why infographics are so effective.
A well-designed infographic is not just a great way to communicate dry or complex information in a visually engaging way, but can also boost your SEO and add plenty of value to your existing content.
Another benefit of infographics is that they are bite-sized and easy to share. This helps create brand awareness, drive more traffic and engagement, and get your brand and content tons of exposure. And when people like and share your content on social media, it instantly gives you an SEO boost. But if you’re not a professional designer, creating a rich infographic from scratch might seem like a difficult task.
The good news is that it doesn’t have to be that way. With tools like Visme, anyone can design great-looking and effective infographics in minutes. You can access thousands of pre-designed templates, content blocks, free icons and photos, and a drag-and-drop editor to put it all together with no design skills needed.
The ability to provide simple explanations for complicated matters is a sign of mastery. But sometimes, words are not enough. Infographics are a great way to simplify and visualize even the most complex subjects. Here is the complete guide on making an infographic that is valuable and eye-catching:
1. Basics. This section provides a definition, scope of use and context for infographics.
2. Reasons to use an infographic. An infographic (goes with a transcript) depicting why using infographics could be a better choice for any project.
3. Signs of a good infographic. 9 definitive attributes of a well-composed infographic.
4. A “how-to” section. Provides a comprehensive guide to creating an infographic in 8 steps.
5. Tools. This section lists many well-known tools to creating infographics alongside brief description of each site/app.
6. Infographic collections. Bonus sections that provides some major infographic-related sites and compilations of infographics (including Pinterest, Cool Infographics, Daily infographics etc.)
This ultimate guide on how to make an infographic will help you learn exactly how to put that into action. You’ll learn how to plan your infographic design, create a wireframe, and then use templates or a blank canvas to make your perfect infographic.
This article contains a step-by-step tutorial on how to put together an infographic using Visme’s infographic maker tool. You will also discover the ten different types of an infographic that come built-in with Visme’s editor, and find out how and when to use each one. We have also included screenshots of Visme’s editor, along with full infographics made in Visme itself to help illustrate the steps involved.

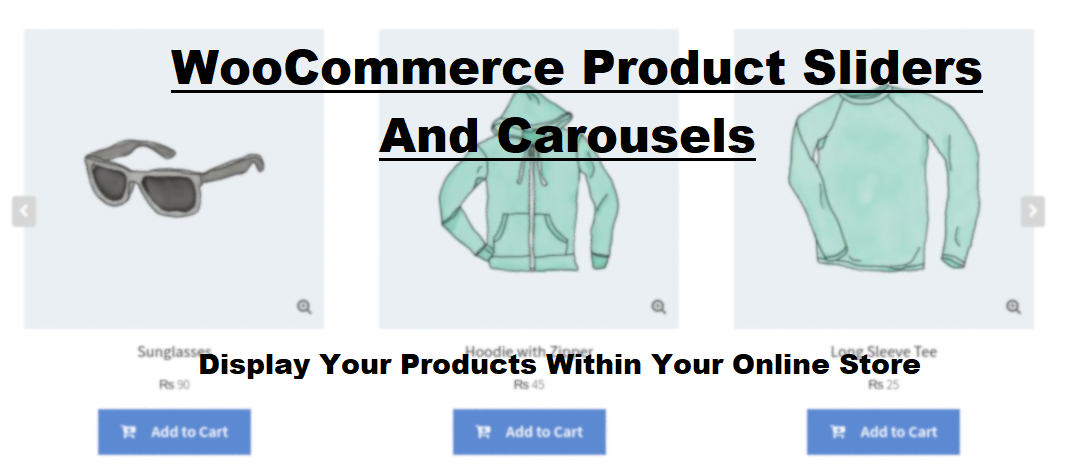
What Is WooCommerce Product Slider and Why Your Store Needs It
Why Do Product Images Matter So Much in Online Stores? When someone visits an online store the…
0 Comments9 Minutes

How to Streamline Your Customers’ Shopping Experience?
The goal for any online store is to make shopping as smooth as possible. When visitors move…
0 Comments8 Minutes

Strengthening Brand-Customer Relationships Through Gamified Loyalty Programs
Creating lasting connections with customers has become increasingly vital as the marketplace grows…
0 Comments6 Minutes

How to Use SEO and SEA Together in Search Engine Marketing
In digital marketing, search engine marketing (SEM) plays a critical role in improving online…
0 Comments10 Minutes
Content Marketing Growth Hacks: Real Shortcuts to Drive Traffic
Are you still lagging in content marketing? Sticking to these old strategies seems…
0 Comments10 Minutes

How to Build a Strong Local Following Using Social Media Marketing
In the days of likes, shares, and stories, local businesses have a golden opportunity to create…
0 Comments9 Minutes

Why WooCommerce is the Best Choice for Your Online Store?
WooCommerce stands out as a top option for anyone looking to build an online store. This platform…
0 Comments8 Minutes

How to Use AI-Powered SEO Tools for WordPress eCommerce
SEO is a critical factor in the success of any e-commerce WordPress store. As competition…
0 Comments11 Minutes