
How to Use Infographics for Link Building
A picture is worth a thousand words, Fred R. Barnard said it in 1921, and it still holds true today. The human brain can process visual information 60K times faster than text.
Quick Links
Using infographics to grab a reader’s attention was first utilized in 2010. Since then, infographics have been favored because of their ability to break complex information into digestible little chunks.
Blog posts that contain meaningful visuals every 100 words can win twice the social media shares than posts with no visuals. To leverage this potential, 67% of B2B marketers prioritize spending their resources on creating unique infographics.
Infographics, when used with an actionable content strategy, can promise millions of views, thousands of social media shares and, most importantly, hundreds of backlinks. However, all this comes from a carefully planned development process and a successful outreach project.
Here are the exact steps you need to follow to get the most links for your infographics.
Step 1. Create a Compelling Infographic
Only compelling infographics can win high-quality backlinks. The characteristics of winning infographics are:
- design that communicates,
- an organized storyline that flows,
- and accurate data from trusted sources.
Creating visually appealing infographics is a lot more than a mere combination of text and images. You should consider the audience’s perspective in your niche and the impacts of color psychology. Did you know that 90% of subconscious decisions are made within 90 seconds based on the color scheme alone?
Below are the essential steps to creating an impressive infographic (more here from the folk at Visme with their ultimate guide to make an infographic).
RESEARCH TOPIC AND TARGET AUDIENCE
Proper research is a vital part of creating infographics that will benefit your target audience. You need to choose topics that will interest your readers and are also in demand. Here are some useful platforms where you can find topics for infographics.
- Google Trends
- Google News
- Linkedin groups
- Twitter Streams
- Facebook Groups and Pages
- Industry Related Forums
Use Google Image Search or Pinterest to determine the type, style, data, and storyline used by successful infographics in your target industry. You can employ the SUCCESS model coined by DeLone and McLean to make sure you cover all your bases during the research.
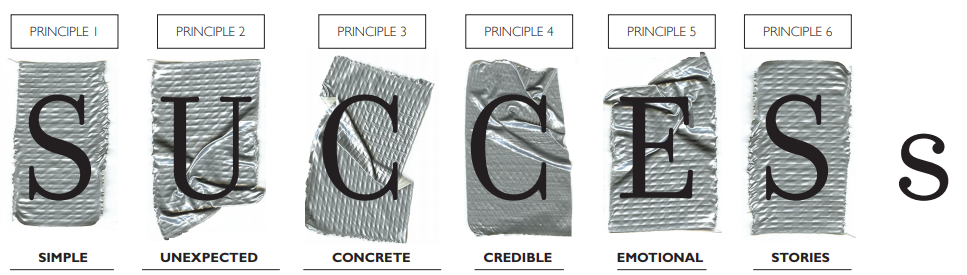
Source: https://heathbrothers.com/download/mts-made-to-stick-model.pdf
The acronym stands for Simple, Unexpected, Concrete, Credible, Emotional Attachment, and Story, while Shareability was later added to the model.
- Simple: Make sure that the idea you come up with for your infographic isn’t overly complicated. Cover a simple topic and add your own expert perspective to it.
- Unexpected: Simple doesn’t mean redundant. Find a unique angle for your infographic that hasn’t been presented yet, something that makes the audience gasp; why did I never think of that!
- Concrete: Can you bring your idea to life in your audience’s imagination? You can use sensory language to convert an abstract idea into actionable insight or a concrete solution.
- Credible: You need to choose a topic for which you can create a credible resource. Your expertise in the niche can be a source of trust. Likewise, using data from trusted sources will also lend credibility to your infographic.
- Emotional Attachment: How well can your audience relate to the topic of your infographic? Can you answer their question, what’s in it for me? The topic you choose must build an association between what you create and what the audience cares for.
- Story: Choose a topic that narrates a story the audience can relate to and feel compelled to take action. Random chunks of information defeat the purpose of creating the infographic as readers cannot take away anything and are less inclined to share it.
- Shareable: Determine if people will like to share the infographic on the topic you chose? For example, when Menstrupedia created their period awareness infographic, many Indian girls (the primary target) must have liked it, but would they share it on their social media? Sharable content is quickly consumed and triggers the interaction, i.e., views, comments, retweets, tags, mentions, and shares.
If you’re using your infographic for link-building, you’ll also want to consider linkable markets upfront. Some audiences are more receptive to infographics and are more likely to share them on their site. You’ll want to create a narrative that plays into one of these markets.
LINKABLE MARKETS AND A COMPELLING NARRATIVE
Now that you know you need to align to a linkable audience, you’ll need to choose one and craft your narrative around it. Ask yourself three questions:
- Who is the linkable market I’m catering to?
- What is the information I’m trying to get across?
- What are the actionable steps I’ll include?
First, think about the market you’re trying to cater to. Business, productivity, eco, pets and lifestyle are all great markets to tailor your information and design to. You can learn more about linkable markets here.
For instance, if you want to create an infographic on high-end luxury cosmetics you may not have success during promotion. Why? Because “beauty” isn’t a linkable market. From creation of the infographic to promotion, you should always have your linkable audience in mind.
Take our hypothetical high-end luxury cosmetics infographic for example, a good tweak could be to aim it at the eco market by covering different tweaks you can make to your beauty routine to make it more eco friendly.
Next, decide on how you want to display your information. The art of visual storytelling isn’t about long paragraphs or random chunks of information put together awkwardly. You need to develop a story with a start, middle, and a logical conclusion. All the text and images support and advance the narrative that your infographic chooses to project.
Use statistics and add humor to make your readers stick around and consume your story. Your infographic is like a visual map that takes your reader from point A to point B and guides them through different sections.
Therefore, it’s essential to visualize the information’s arrangement in a way so that all chunks have a logical connection and advance the narrative.
CREATE A WIREFRAME AND FINALIZE DESIGN
In this infographic creation phase, you will need to determine the font size, style, colors, and other design elements. You may need to work with a designer to tweak the outcome. Alter font size as required, but it’s best to stick to two font styles; one for basic information and one for the highlights to catch the readers’ eyes.
You also don’t want to overcrowd your infographic, so it’s best to have your designer create a wireframe first to see what information or design element goes where. Be mindful of the white space and avoid too long or too wide infographic.
Use bullet points and choose color schemes based on color psychology. Add data sources at the end of the infographic to build credibility. Do not oversize the logo as it will make your infographic seem salesy. Keep it for last; it’s not the highlight of your visual.
When the first draft is ready, get feedback from your employees whether they’re similar to your target audience or not.
Step 2. Publish Your Infographic
Once your infographic is ready, publish it on your website so journalists and bloggers who use your infographic have a credible platform to link back to. Add a custom post for your infographics to walk your readers through the problem or situation that inspired it-bonus points if you can tie it to search volume for a post that will rank.
Writing a separate blog post allows you to add relevant keywords for the post to rank. Google prefers and ranks content that is unique and contains self-explanatory images and visuals. The links pointing back to it will also help the post to rank more quickly.
For instance, check out this article and infographic from a fragrance brand. They have added a post that’s built to rank and relevant to their audience. The links generated to the infographic helped the post to rank, and it’s now ranking #1 for “how to apply cologne”, a great keyword for them.
Don’t forget to add an ending paragraph or conclusion with an appropriate call-to-action (CTA), which may ask them to buy a product, make an appointment, take an online test, or visit your store.
Step 3: Share Your Infographic on Social Media
Social media is the jury of content marketing. When you share your infographics on social media, you are presenting your work to millions of people.
It’s essential to share the infographic with a clickable post directing to your website to bring all that traffic home. If the infographics are persuasive and attractive, people will not hesitate to click and read your in-depth article around the same topic. The key is to engage specific audiences and acquire organic traffic.
ADVERTISE ON SOCIAL MEDIA
To boost your promotion plan, it’s helpful to choose a few platforms with the most organic engagement to boost your post on. Pay attention to how the visual performs. Assess the presentable data, i.e., views, comments, shares, and mentions, and notice the audience demographics that engaged with your content the most.
Here are some basic social platforms to consider.
- Facebook: It’s the largest social platform with easy, accurate, affordable, and most comprehensive promotional plans for engaging a broader audience.
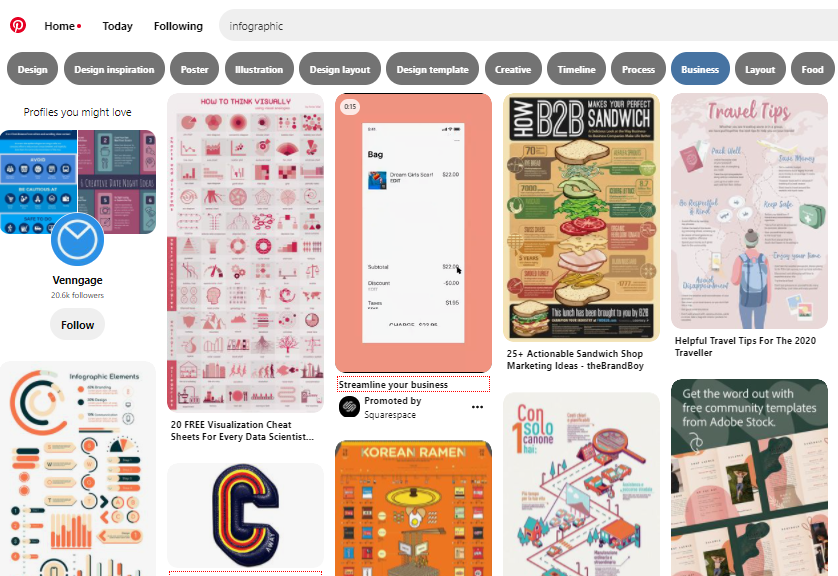
- Pinterest: It’s essential for visual content promotion, especially for infographics. Pinterest ads are flexible and allow you to target specific demographics as accurately as Facebook.
- Twitter: 13% of tweets that require you to download through a posted link get a positive response. Since tweets allow a minimal number of characters, you can use it for the link and add an infographic to get your message across. Twitter pay-per-performance ads are far superior to Facebook and LinkedIn.
- LinkedIn: Though LinkedIn focuses less on visual content, if you’re a B2B company, it can be an effective platform to present your infographics to target business groups. Instead of LinkedIn ads, use LinkedIn Sponsored Content, which is more effective at generating leads.
Step 4: Reach Out to the Related Linkable Audiences
Since you’ve created an infographic that maps to a linkable audience, you should have no problems reaching out to them. Since the information is relevant to their readers, people in linkable markets will be happy to share your content.
Just make sure you have a well crafted pitch email and are reaching out to folks who will be genuinely interested in what you’re sharing.
A GOOD PITCH EMAIL
A well-crafted pitch is neither too long to bore the recipient nor too short to be undecipherable. It’s concise, clear, and simple to respond to. Personalize the pitch and make sure to follow the following tips.
- Focus on why the infographic is relevant to the blogger’s audience.
- What makes your infographic unique.
- Make it easy for the recipient to share and publish your infographic.
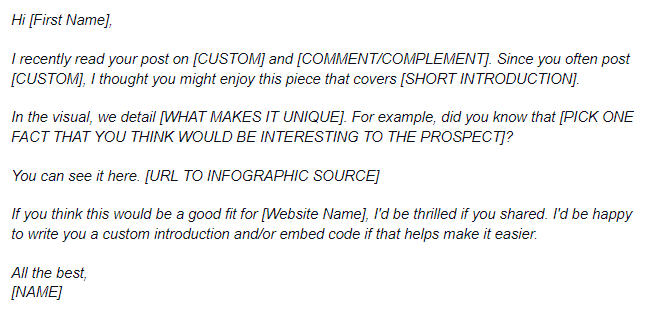
Here’s a sample pitch for using infographics for link building.
AUDIENCES WHO ARE NOT RECEPTIVE
There are a few linkable markets who aren’t super receptive to infographics. They aren’t super popular among websites and industries catering to seniors-they prefer guides and long-form resources.
So, if you’re planning to create an infographic for them, you might want to rethink and re-research. Beauty bloggers aren’t too keen at sharing infographics either since they prefer printables and checklists. High-end news channels don’t tend to publish infographics either, preferring surveys or studies.
Step 5: Offer to Write Custom Intros
When you’re pitching your infographics to relevant prospects, bloggers, or journalists, and they ask you to write a custom intro, go for it by all means. Even if they don’t, offer to write a custom intro since it’s in your interest to set the narrative for your infographic.
Writing the custom intro yourself has various benefits.
- You can add a contextual backlink to your site.
- You can choose the anchor text for your link.
- You can place relevant keywords in the text.
- You can add an additional link sometimes.
Writing a custom intro yourself also prevents unnecessary delays in publishing. If you leave it up to the bloggers to write the introduction, they may delay your post in favor of other ready-to-publish content.
Step 6: Include Links to Product Pages or Category Pages
We’ve already discussed the importance of publishing the infographic on your website and sharing it with a link back to your website. But sometimes, where it makes sense, you can also add a link to a higher value category or product page on your website.
As long as it’s relevant to your topic and provides value to the audience, there’s no harm in adding an additional link to boost your link building efforts and boost the effectiveness of your content marketing.
For example, suppose you’ve created an infographic on essential oils’ benefits. In that case, you can add another link to the page containing your original research and the product page where you sell essential oils. If your infographic came off as credible and useful, there’s a high chance people will click on your link to read more or buy from you.
Step 7: Track Your Published Links
When you’ve spent so much time and effort at creating and distributing your infographics you’ll want to see the fruits of your efforts. It’s essential to track your published links, retweets, shares, and page views to set the pace for your future marketing plans.
Consider this infographic from Vertical Measures. Eighty high-profile websites embedded it, and it received more than 600k views, 145 live backlinks, 33 live referring domains and was pinned for more than 100k times on Pinterest.
But how do you track your published links?
The bloggers whom you pitched for links will typically inform you themselves when your infographic is live. You can also keep an eye on their websites to see when your content is published. But if your infographic is really successful, many people are likely to link to it without informing you or asking for permission.
You can use Reverse Image Search to find the webpages that have used your infographics. Google image search is best for a manual search, or you can use tools to track the backlinks and alert you about the different places your infographics are published.
Backlink checker tools like Ahrefs, SEMrush, or Moz are all great for this purpose. When you find your infographic has been published on a website you reached out to, make sure to thank the blogger. It not only shows professionalism but also creates opportunities for future collaborations with them.
Infographics capture the users’ visual sense and are the smartest ways of increasing your website traffic and rank through potential link building. Any blog or article with an infographic becomes more persuasive and serves as an efficient tool for getting authoritative backlinks from high profile websites. Quality linkbacks and shares send positive ranking signals to Google and pull your website up the SERP.
Author Bio
Karli is a content marketer and founder of boutique agency JuiceBox. With over 10 years in the marketing industry, she’s worked with brands large and small across many industries to grow organic traffic and reach new audiences. She writes on everything from content marketing, social, and SEO to travel and real estate. On the weekends, she loves to explore new places, enjoy the outdoors, and have a glass or two of vino!
What Is WooCommerce Product Slider and Why Your Store Needs It
Why Do Product Images Matter So Much in Online Stores? When someone visits an online store the…
0 Comments9 Minutes

How to Streamline Your Customers’ Shopping Experience?
The goal for any online store is to make shopping as smooth as possible. When visitors move…
0 Comments8 Minutes

Strengthening Brand-Customer Relationships Through Gamified Loyalty Programs
Creating lasting connections with customers has become increasingly vital as the marketplace grows…
0 Comments6 Minutes

How to Use SEO and SEA Together in Search Engine Marketing
In digital marketing, search engine marketing (SEM) plays a critical role in improving online…
0 Comments10 Minutes
Content Marketing Growth Hacks: Real Shortcuts to Drive Traffic
Are you still lagging in content marketing? Sticking to these old strategies seems…
0 Comments10 Minutes

How to Build a Strong Local Following Using Social Media Marketing
In the days of likes, shares, and stories, local businesses have a golden opportunity to create…
0 Comments9 Minutes

Why WooCommerce is the Best Choice for Your Online Store?
WooCommerce stands out as a top option for anyone looking to build an online store. This platform…
0 Comments8 Minutes

How to Use AI-Powered SEO Tools for WordPress eCommerce
SEO is a critical factor in the success of any e-commerce WordPress store. As competition…
0 Comments11 Minutes