
How to Measure User Engagement on Your Website (and Boost It)
According to Gallup research, fully engaged customers are 23% more likely to spend with you compared to average customers.
Quick Links
It may look simple: a user that gets what they want from your site, can do so easily, and enjoys doing it is an engaged user.
But how to make sure your website users are engaged? And if they are not, how to correct the situation?
In this guide, I’m going to show you how to measure user engagement, what tools to use for that, and how to boost the engagement rate if things are not going well.
What’s User Engagement and Why Bother
But first, let’s figure out what user (or visitor) engagement actually is. In plain English, it’s a degree that shows how much time users spend interacting with your website. These interactions may include downloads, comments, click-throughs, social shares, and so on.
Today, it’s hard not only to capture users’ interest but make them know about your website. Besides, if people don’t like something on your page at first sight, they will switch to another site in, like, 8 seconds.
And if a website doesn’t engage visitors, it wastes everyone’s time. Not to mention money.
That’s why, according to the McKinsey survey, C-level management finds building a website engagement strategy a first priority task.
So, why is user engagement is that important?
- Engaged users feel like a part of your brand. They are more loyal and familiar with your brand, and when the time comes to order some services or products, they go to the company they trust.
- Better relationships = increased profits. R ‘Ray’ Wang claims that brands that work hard on their engagement metrics (like page views, time spent on a page) gain more profits. Their order sizes increase by 80%, cross-sell revenue by 22%, and up-sell by 38%.
- It’s good for your brand awareness. Google keeps an eye on your website: the longer users stay on it, the higher it may rank. And if you post great and useful articles, users will share them on social media, with their friends and colleagues. Word-of-mouth marketing is still effective in 2020.
Website Engagement Metrics
There are no perfect metrics that can tell you how engaged your users are. Metrics are different for different websites:
- Time and pages per visit for news websites or blogs
- Conversion rate and core actions on sites that offer products or services
- ‘Add to cart’ clicks and the number of viewed items on ecommerce websites
Let’s take a look at some of the most important metrics.
Attention minutes
Or engaged time. It tracks the time a user spends doing something – watching a video, reading a blog post, clicking on links, or just moving the mouse.
If they spent a minute reading info on your webpage then switched to another tab, the metrics would capture one minute only.
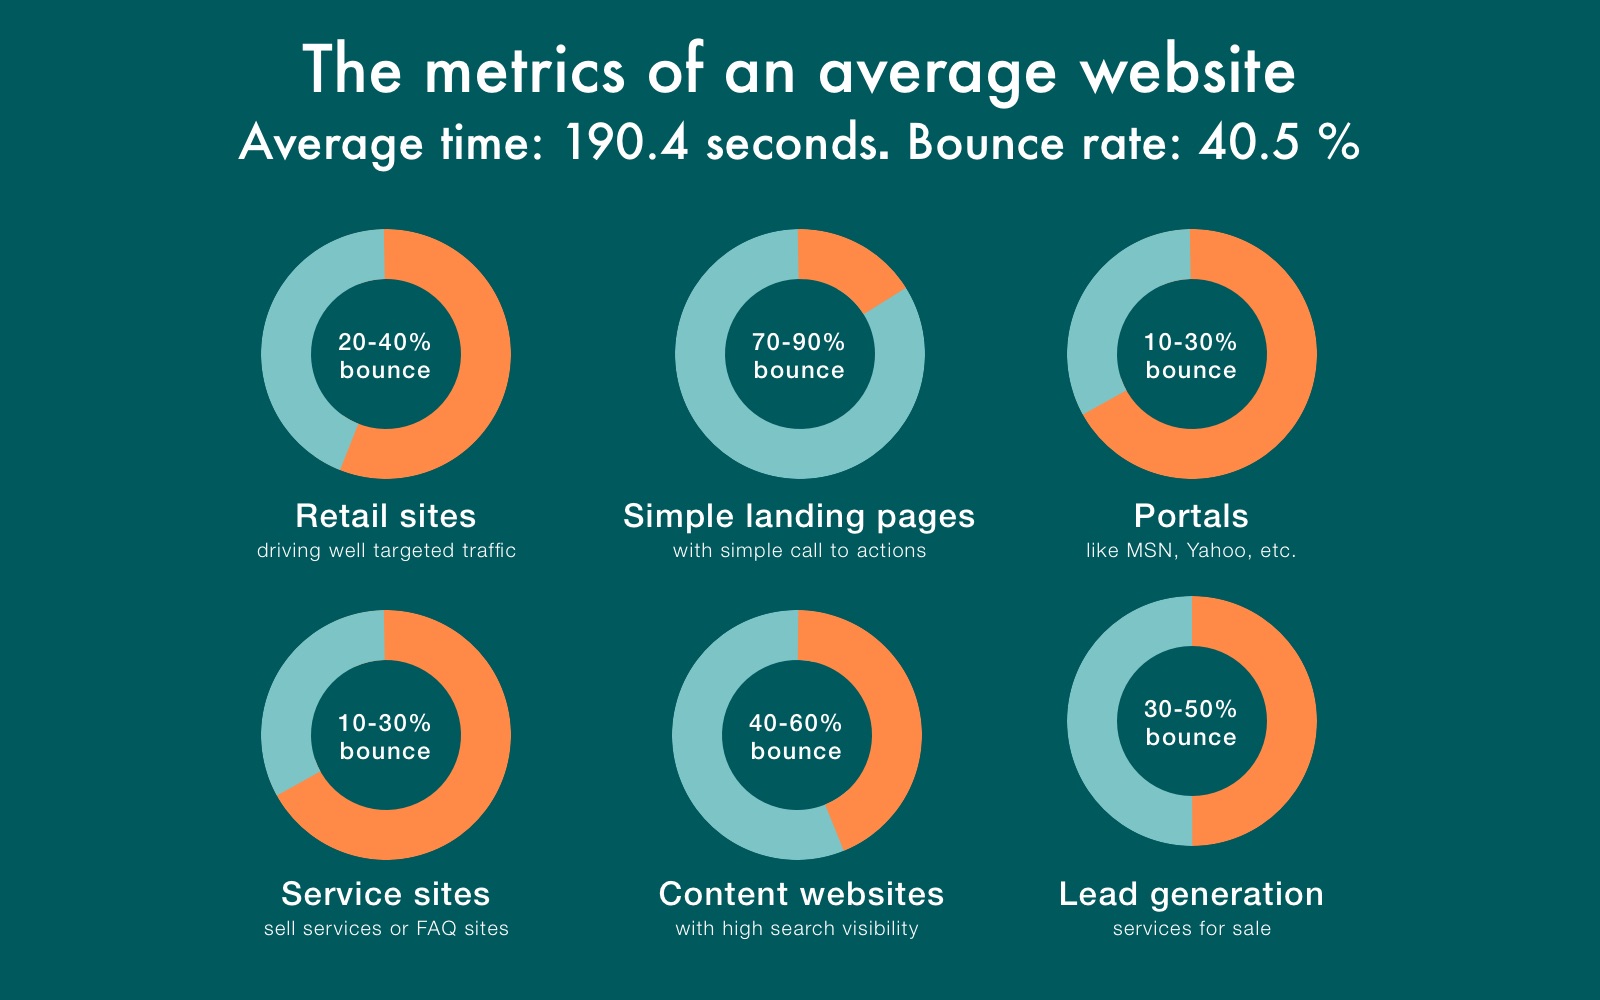
Bounce rate
A low bounce rate is a sign of good engagement. It means your website looks and works right, and users can find the information they need on your webpage.
Still, this indicator depends on the type of the website (according to Neil Patel):
- landing pages have the bounce rate of 70-90%
- content websites – 40-60%
- services sites – 10-30%
- ecommerce websites – 20-40% bounce
The most popular reasons for high bounce rates are bad design, auto-playing music or video ads, and too many pop-ups on a webpage. Or it may be low-quality content filled with powerful but irrelevant keywords.
Frequency of visits
It’s simple: if users are returning to your website, it means they like your content or services and are ready to learn or buy more.
First, look at how many times a user visits the website over a specific timeframe like two weeks or a month.
Next, find out the average number of days between those visits.
If you’re updating your website every week, but users return to it once a month, you might have a problem. But if you update it monthly and users get back to you once a month, everything works just fine.
Core user actions
The mere fact that users found your call-to-action and responded to it shows that your design is clear, and the website is converting.
If you’ve created a video game or MMORPG, the list of core actions includes users joining the game or paying to download it.
If you have a blog with a newsletter, it’s people signing up to get emails from you.
To catch these metrics, figure out what actions are essential for your type of website. Then set up a goal on the analytic tool you’ve picked. (We’re going to talk about tools in the next part).
Finally, here’s a tip: don’t measure user engagement with just one metrics, be it a number of visitors, page time, or bounce rate. Use many metrics together to have a full picture of your website’s performance.
5 Tools to Monitor and Analyze User Engagement
As promised, here are the tools that can help you measure user engagement on your website. I’m going to start with some of the best.
Google Analytics
Google Analytics (GA) has a lot of metrics that will help you understand user engagement. It measures the bounce rate, tracks the time on page, average session duration, and many more.
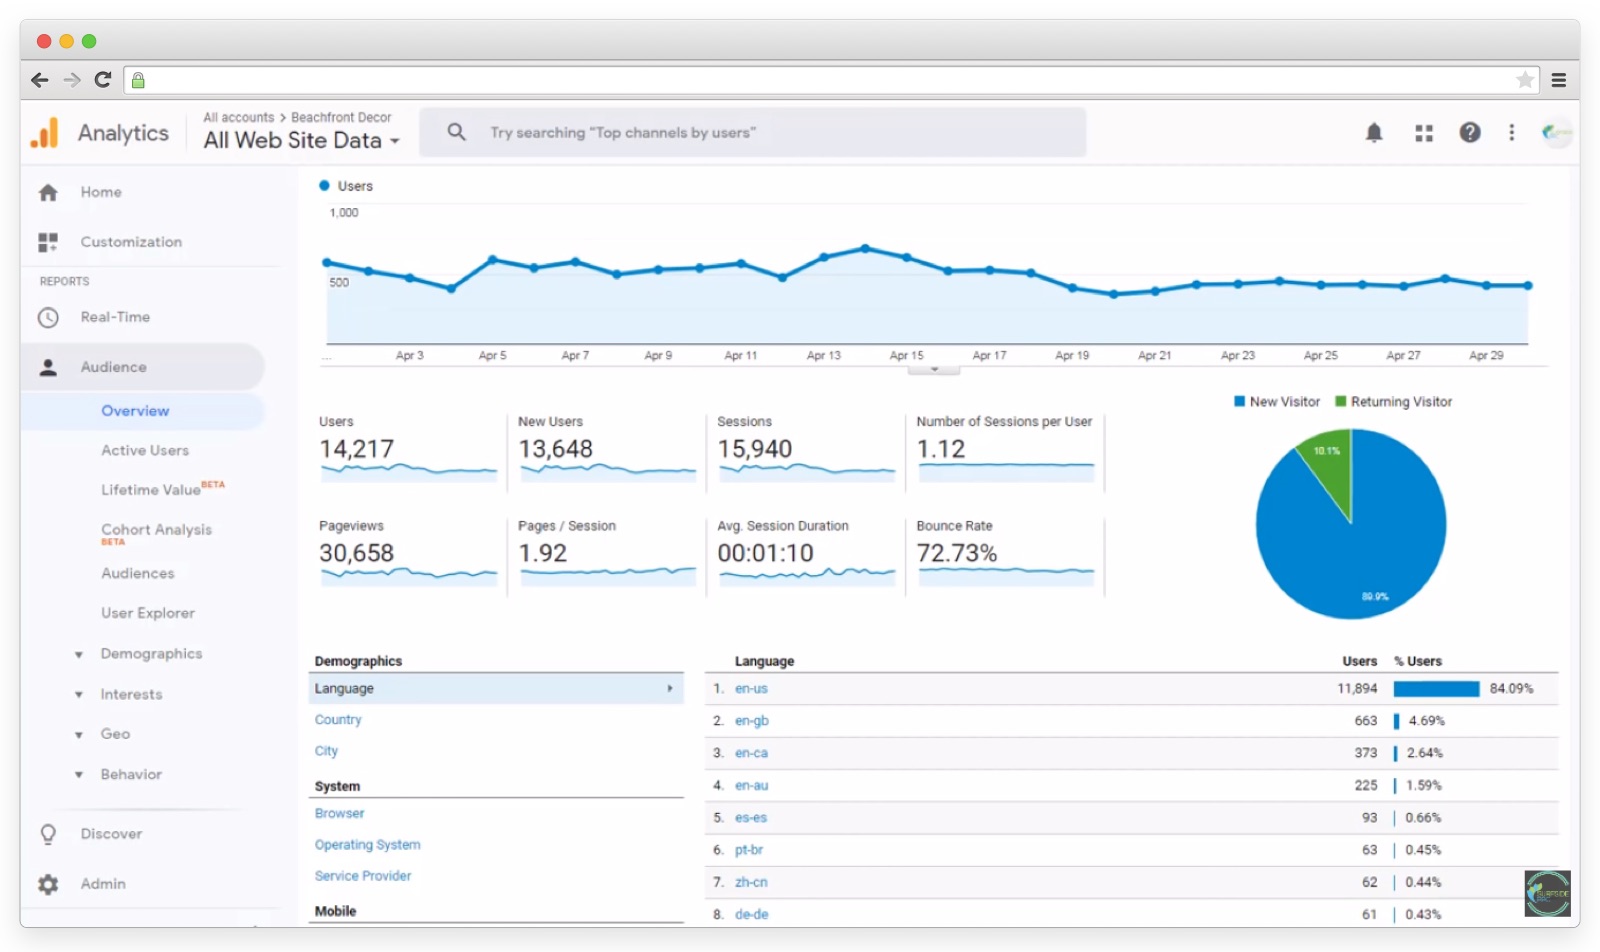
It knows:
- where your visitors come from (so you can target messaging)
- your site’s traffic sources – social media, PPC, referrals (so you know what sources work and what don’t)
- how people are spending time on your site and for how long (so you know what content is and isn’t working)
GA gives valuable insights using which you can use to configure targeting, create better content, improve user experience, and conversion rate.
Hotjar
Hotjar is a web analytics tool that helps you understand how visitors behave on your website.
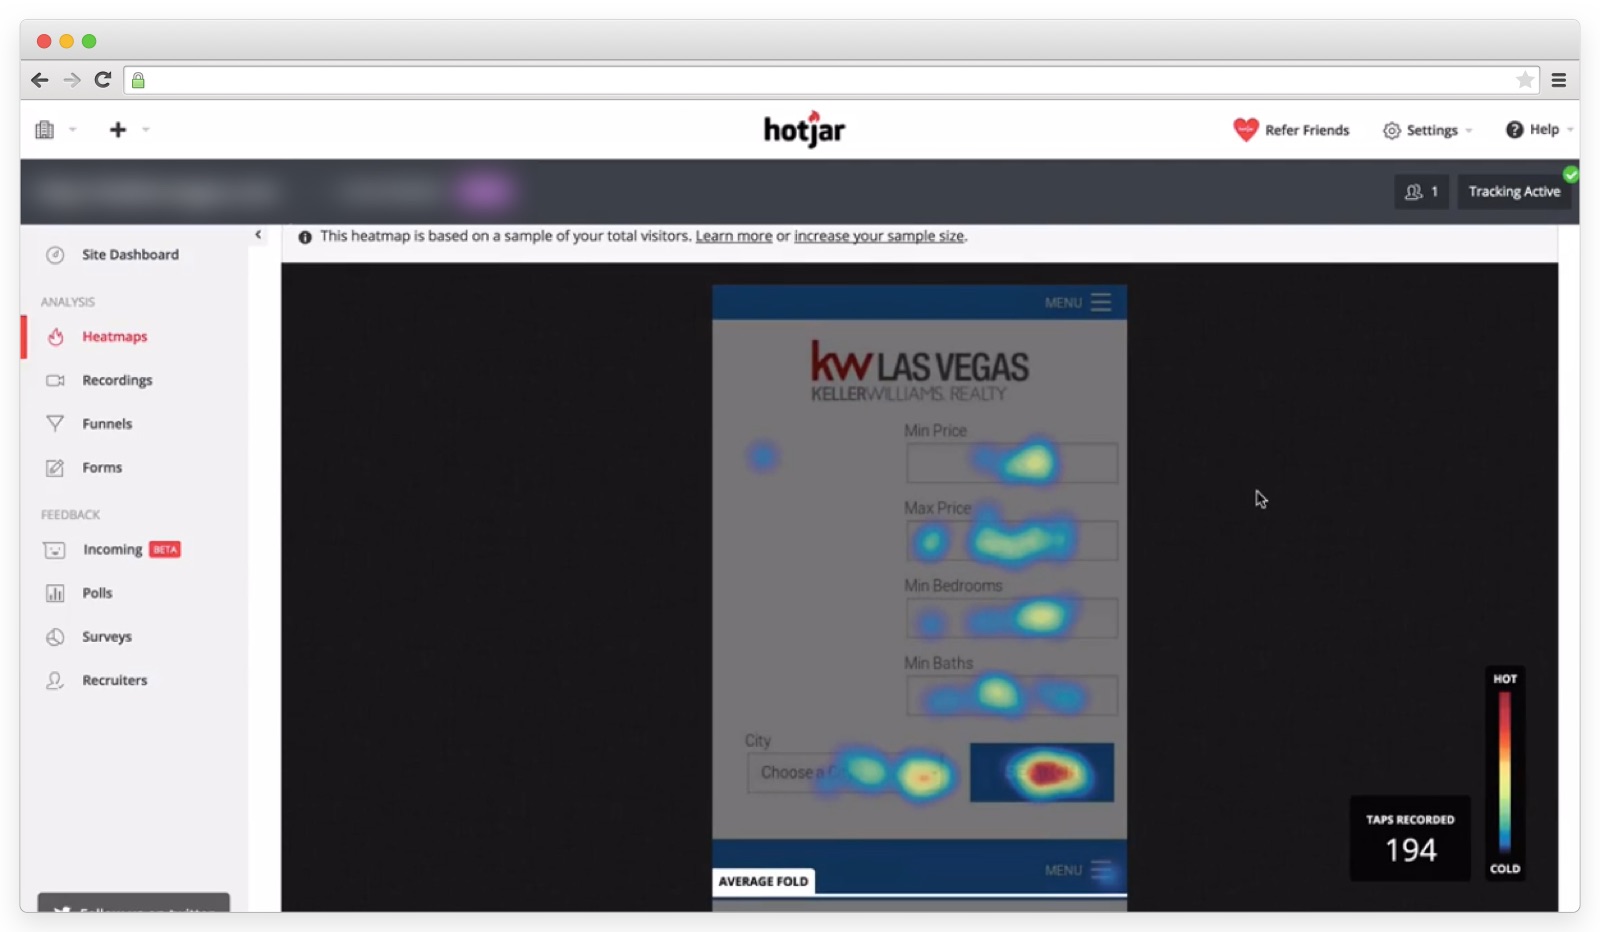
With Hotjar, you can create heatmaps – one of the best things for finding what exactly on your webpage makes users more engaged. They show what grabs users’ attention, clicks, taps, and scrolling behavior.
Hotjar also has a killer recording feature that records user actions on a website. You can see how their cursor moves, the clicks, and follow their user journey in real-time.
You can use Hotjar together with Google Analytics, where GA shows where your UX design doesn’t work right, and usability testing with Hotjar shows why.
Finteza
Google Analytics is may be efficient at tracking your primary page goal, but it’s not easy to use for comparing CTAs on your website.
You probably have a bunch of CTAs like:
- Download now
- Register for webinar
- Buy now
- Subscribe
- Start a free trial
- Contact us
Finteza helps to tracks and analyze all the CTAs: it sorts conversion numbers by event, channel, or the position of the CTA on a webpage.
It’s a much clearer tracking tool compared to Google Analytics, so give it a try.
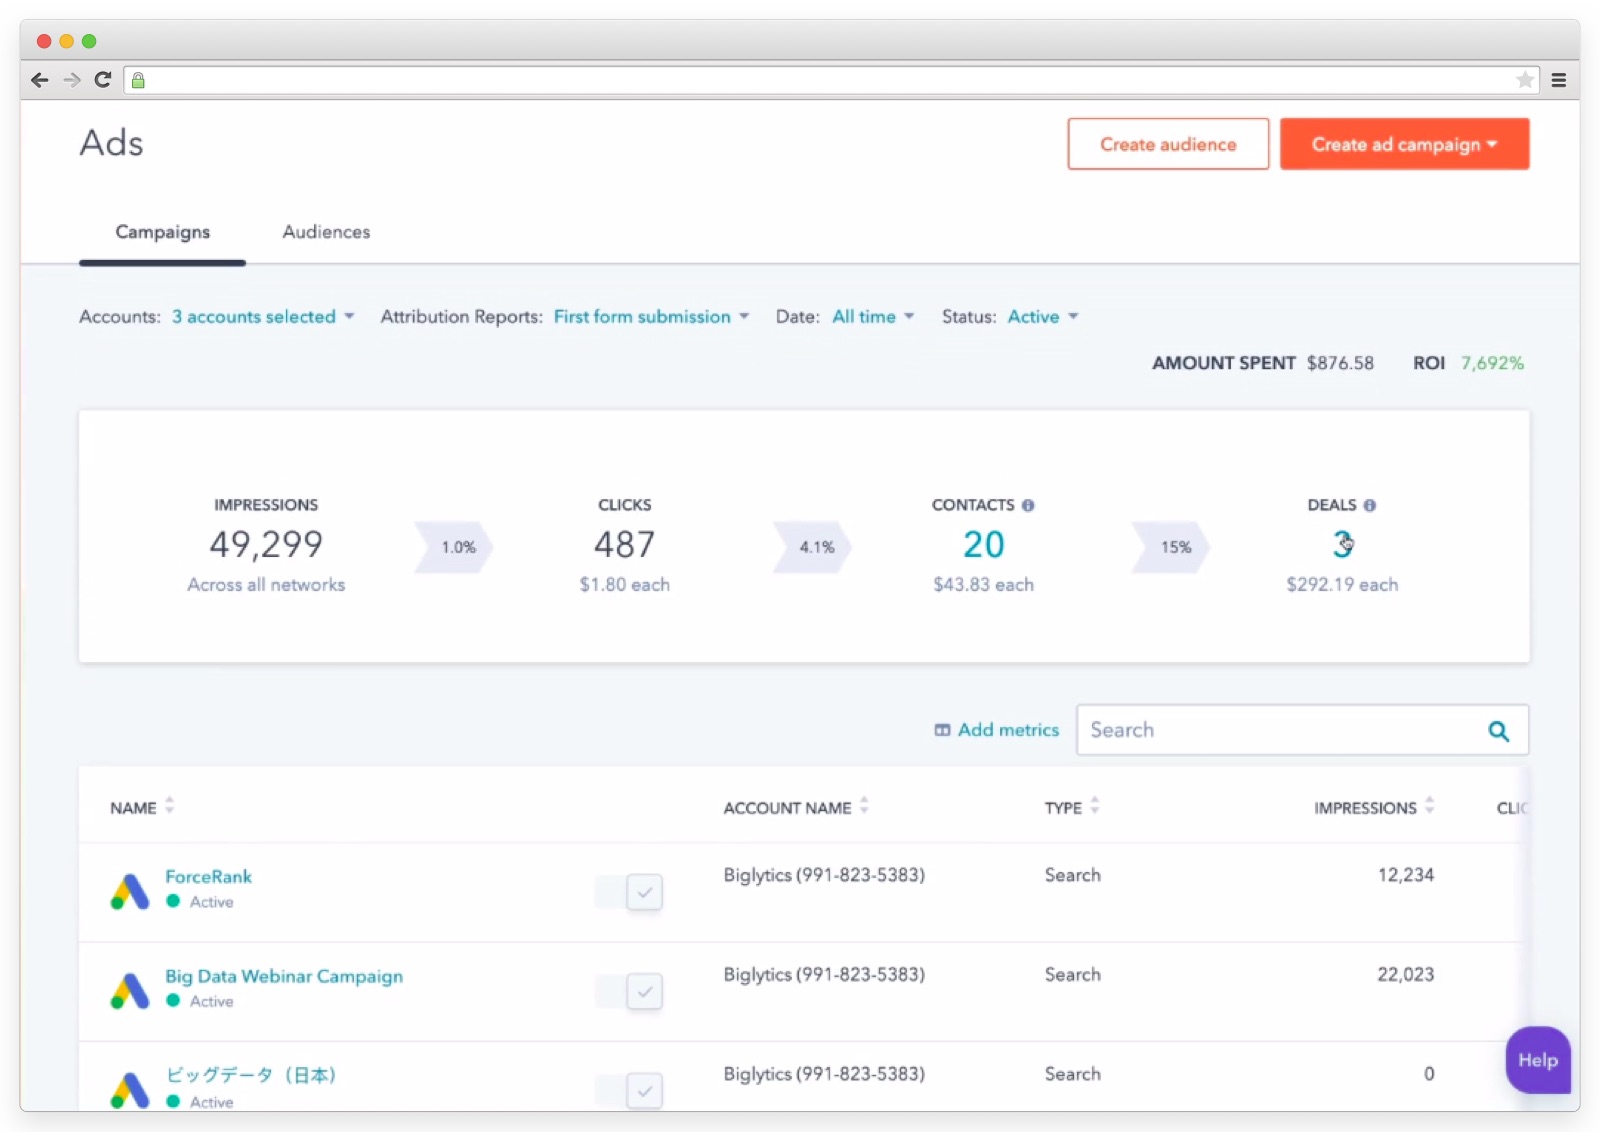
Hubspot
Hubspot is a well-known marketing suite with a huge number of features. It offers tools like landing page builder, SEO optimizer, and separate repository for generated leads.
Ad tracking feature will help you monitor ROI of AdWords, LinkedIn, or Instagram marketing campaigns.
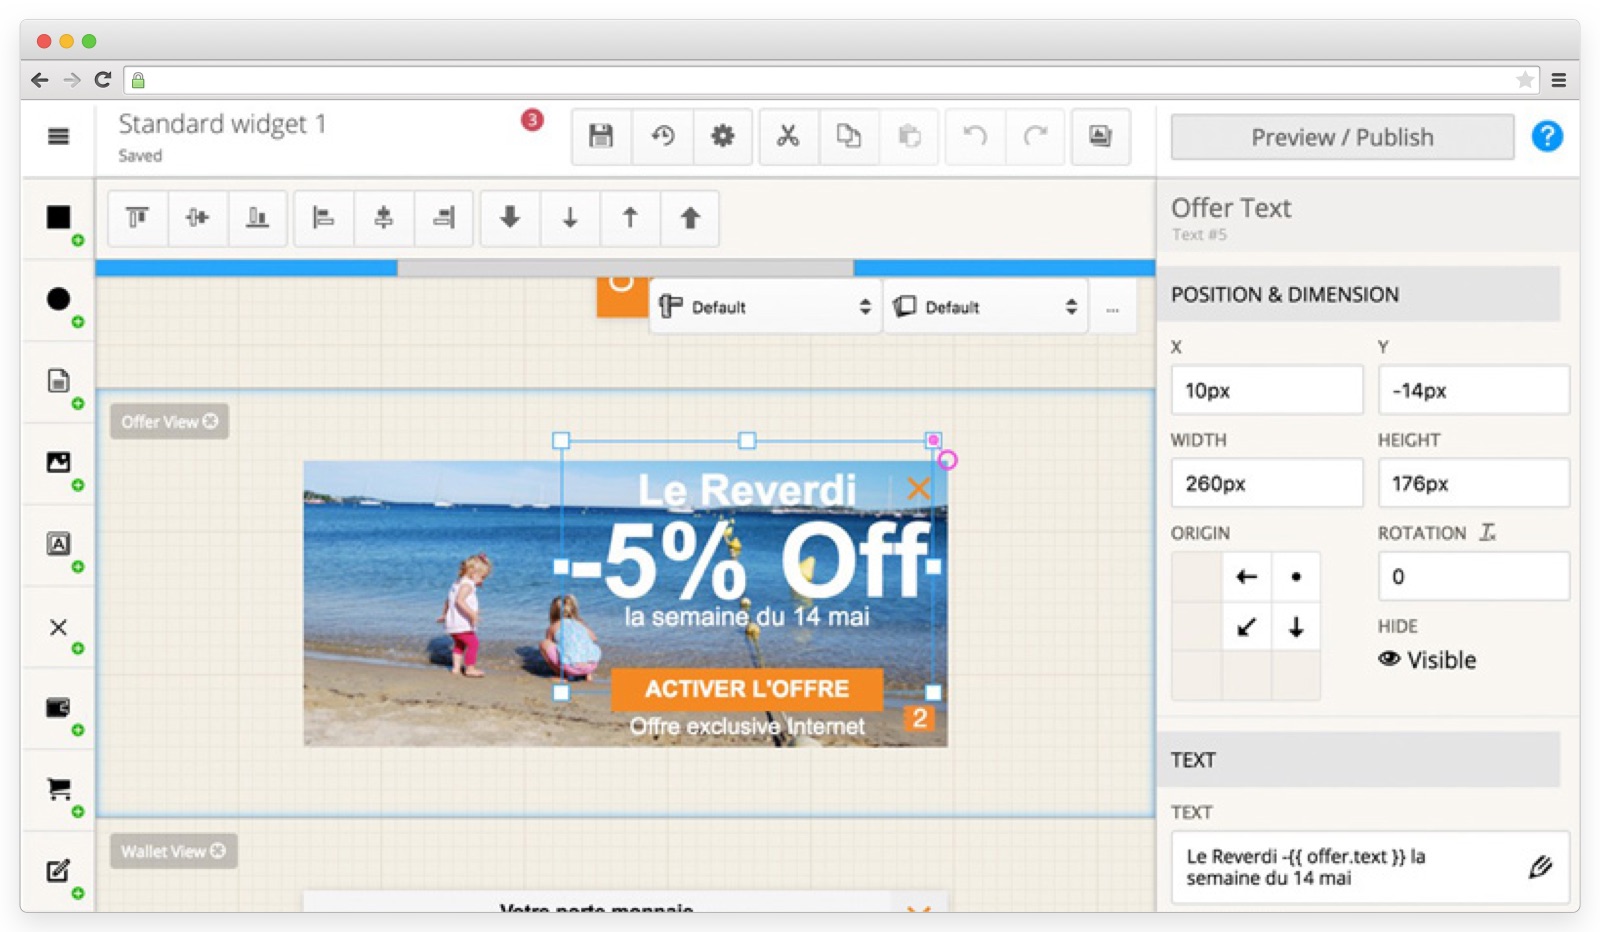
FanPlayr
FanPlayr tool can help with analytics, segmentation, optimization, and messaging.
With FanPlayr, you can track a large number of metrics like orders, conversion rate, net revenue, visits, and analyze the conversion funnel.
What’s more, this service has a simple tool to create cool banners and emails.
How to Boost User Engagement: Content & Design Tips
Now, we know that user engagement matters and know how to measure it. But what if you’ve checked the metrics and they are not looking good?
Here are a few things you can do to fix it.
Reduce page load time
According to Neil Patel, 40% of people abandon a website if it takes more than 3 seconds to load.
How fast should your website load then? According to Dotcom tools:
- 1 sec – excellent
- 2-3 sec – very good
- 4-7 sec – normal, but there is room to grow
- 8-10 sec – bad
- 11+ sec – terrible; you’re losing money!
These services will help you check your website load time:
If you want to know how much your company will make after you reduce the load time, try Sharpe Digital calculator.
According to the Strangeloop study that tested the loading speed of 2,000 top online stores, the average load speed is 10 seconds. The fastest websites were CVS.com (1.02s), Polo.com (1.9s), eCrater.com (1.95s). Amazon’s website loads for 3.26s.
After checking the loading speed indicator, look what makes the webpage load slow. Compress pictures, get rid of useless plugins or change your host.
Think through website UI design
ResearchGate claims that good UI/UX design makes up to 94% of the overall first impression. When users open a new page and see boring, old-fashioned, or overloaded design, the first thing they’re going to do is to close the tab.
Let’s see what you can do to not let it happen.
#1. Be mobile-responsive
According to Statista, 51.2% of global internet traffic happens on a mobile device.
Users won’t return to your website if they have to pinch and zoom, see vast blocks of text, or fight overlapping page elements.
Same for SEO: search engines don’t love sites that aren’t mobile-friendly.
#2. Attract with quality design
Keep your site design systematic and clean, and pick a simple layout that makes visitors focus on the essential parts, namely, the content.
A few other tips:
- Choose readable fonts. When your content looks appealing, users like it more. In most cases, there’s no need to use more than three fonts on one website.
- Don’t be scared of white space. It separates page elements, making it easier to navigate. Don’t overload your website pages with tons of information: it’s hard to know where one idea ends, and another begins.
- Keep trying. Change the position of some elements with A/B testing and see how it impacts engagement and conversion.
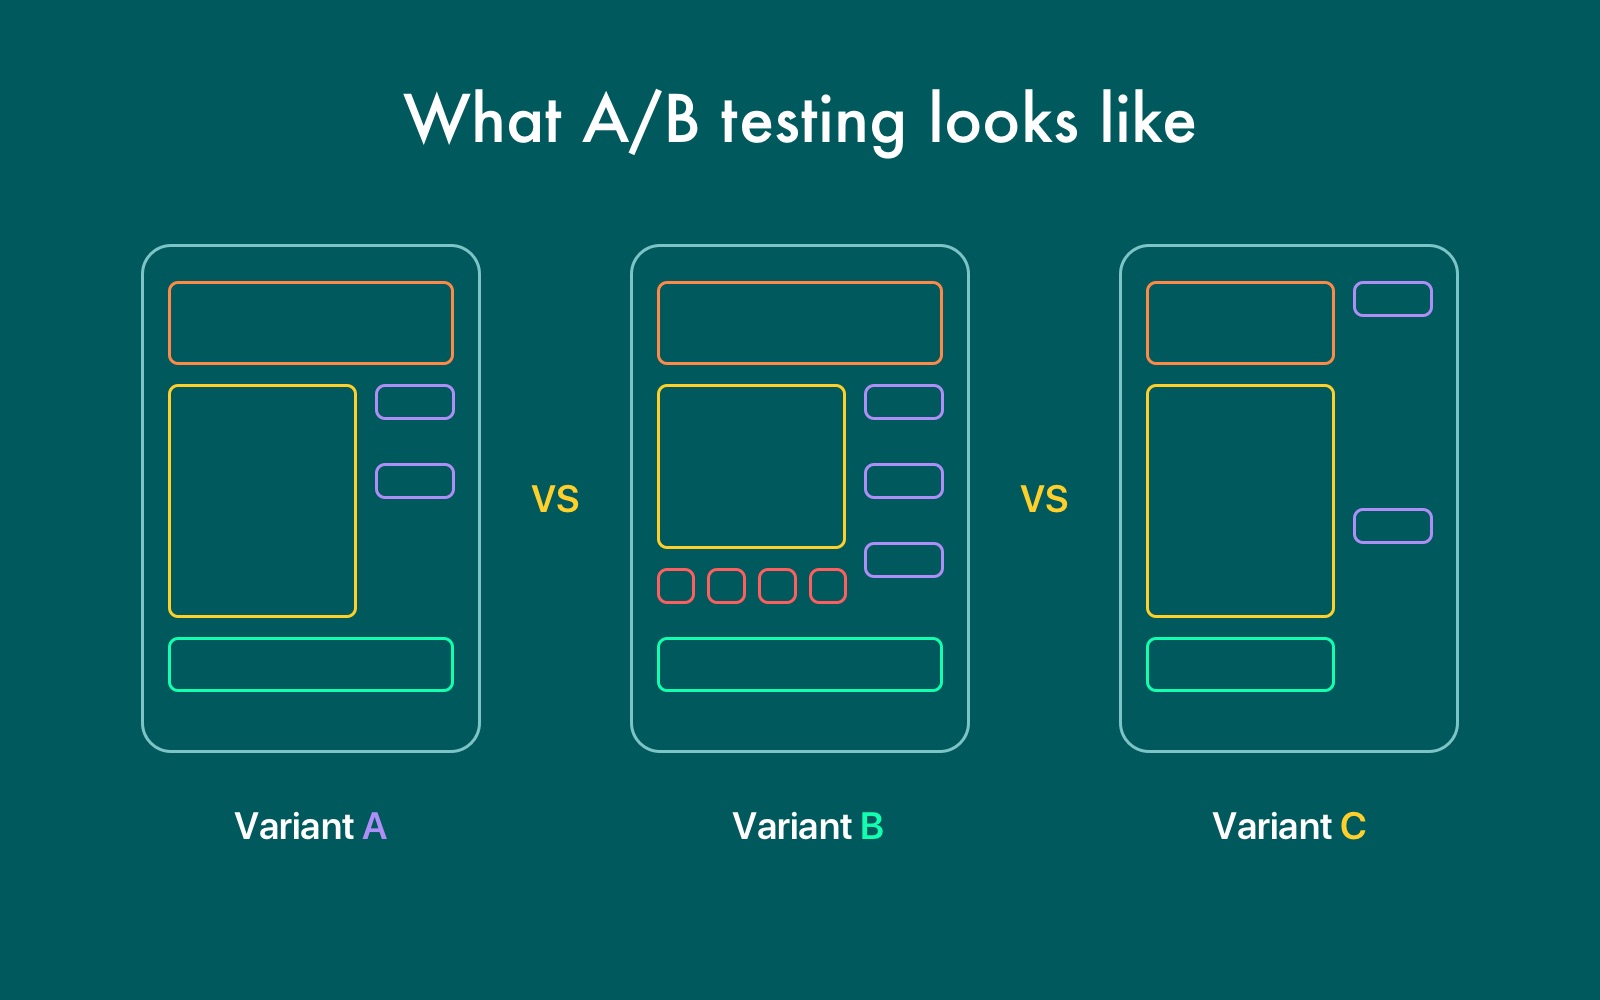
A/B testing (sometimes called split testing) is the practice of showing two variants of the same webpage to different types of visitors. And then comparing which design drives more conversions.
Make a bet on content marketing
Because content marketing rocks. Website speed and design worth nothing is there’s no engaging and useful content.
Make your content attractive and easy-to-read. It’s quality over quantity, always. Use catchy headlines and engaging content with a brand’s voice, add colorful pics, and high-quality photos of the products you’re selling.
Complex sentences and fancy words won’t do here: write the way you speak.
And don’t forget to optimize texts for search engines. Make your content visible for search engines, but don’t use too many keywords. Use only relevant keys and practice white-hat SEO.
Make website navigation look easy
With awful navigation, users won’t find what they need, whether it’s a product, your company description, or a blog article.
And if people won’t find what they need on your website, they’re likely to look somewhere else. Here’s what you can do to avoid such situations:
- Show related content. This will increase the time spent on your site and the number of pages a user visits. If we’re talking about a blog, show related articles. If it’s an ecommerce website and you’re selling food for dogs, offer to choose a dog bowl or snacks.
- Internal linking helps to navigate the website and defines its architecture. Add navigation menu with the most popular pages like Homepage, Services, About, Contacts. But don’t go over it and add a ton of links.
Interact with users
Visitors should be able to interact with your content, reach out through your social media accounts, and submit questions or comments.
Add a live chat and hire a person who will provide users with ongoing support. Make the chat visible, yet not annoying. If you get a lot of the same questions, add an FAQ covering the most popular ones.
And don’t forget about social media. Let users share your content on Facebook or Twitter, Pinterest, or LinkedIn by adding social media buttons.
If users can register on your website, make the process easier: let them sign in via social media accounts.
That’s It!
Figure out what metrics are important for your website: low bounce rate, number of visits, or their frequency. Or maybe it’s attention minutes you’d want to track. Or all these metrics at once.
Find the most convenient tool: I recommend trying some of the big ones like Google Analytics, but some of the smaller ones like Hotjar or Finteza look amazing too.
Now that you know how to engage users on your website, you can start converting visitors into buyers.
Author’s bio
Vitaly Kuprenko is a writer for Cleveroad. It’s a web and mobile app development company with headquarters in Ukraine. He enjoys writing about technology and digital marketing.
What Is WooCommerce Product Slider and Why Your Store Needs It
Why Do Product Images Matter So Much in Online Stores? When someone visits an online store the…
0 Comments9 Minutes

How to Streamline Your Customers’ Shopping Experience?
The goal for any online store is to make shopping as smooth as possible. When visitors move…
0 Comments8 Minutes

Strengthening Brand-Customer Relationships Through Gamified Loyalty Programs
Creating lasting connections with customers has become increasingly vital as the marketplace grows…
0 Comments6 Minutes

How to Use SEO and SEA Together in Search Engine Marketing
In digital marketing, search engine marketing (SEM) plays a critical role in improving online…
0 Comments10 Minutes
Content Marketing Growth Hacks: Real Shortcuts to Drive Traffic
Are you still lagging in content marketing? Sticking to these old strategies seems…
0 Comments10 Minutes

How to Build a Strong Local Following Using Social Media Marketing
In the days of likes, shares, and stories, local businesses have a golden opportunity to create…
0 Comments9 Minutes

Why WooCommerce is the Best Choice for Your Online Store?
WooCommerce stands out as a top option for anyone looking to build an online store. This platform…
0 Comments8 Minutes

How to Use AI-Powered SEO Tools for WordPress eCommerce
SEO is a critical factor in the success of any e-commerce WordPress store. As competition…
0 Comments11 Minutes